Articles
How Satisfied Are Cruise Tourists? | Data Analysis of Cruise Tourists Visiting Japan from Three Countries Part 2
In the previous post, we summarized the gender, age, income, and destinations of cruise tourists from China, Taiwan, and Korea.
This time, we will look into how satisfied cruise tourists are.
Cruise Tourist Satisfaction
Research Topics and Methodology
In this survey, we evaluated eight aspects of cruise tourist satisfaction, including: service quality, costs, environment, facilities, food, activity arrangements, ticket booking, safety, and check-in convenience.
Additionally, regarding the method for calculating satisfaction, we collected survey responses using a five-point scale, from “very dissatisfied” to “very satisfied.” Each response was assigned a score from 1 to 5, allowing us to calculate the average satisfaction score for each aspect.
Satisfaction of Cruise Tourists by Country
First, the overall satisfaction levels of cruise tourists by country are shown in Figure 1.
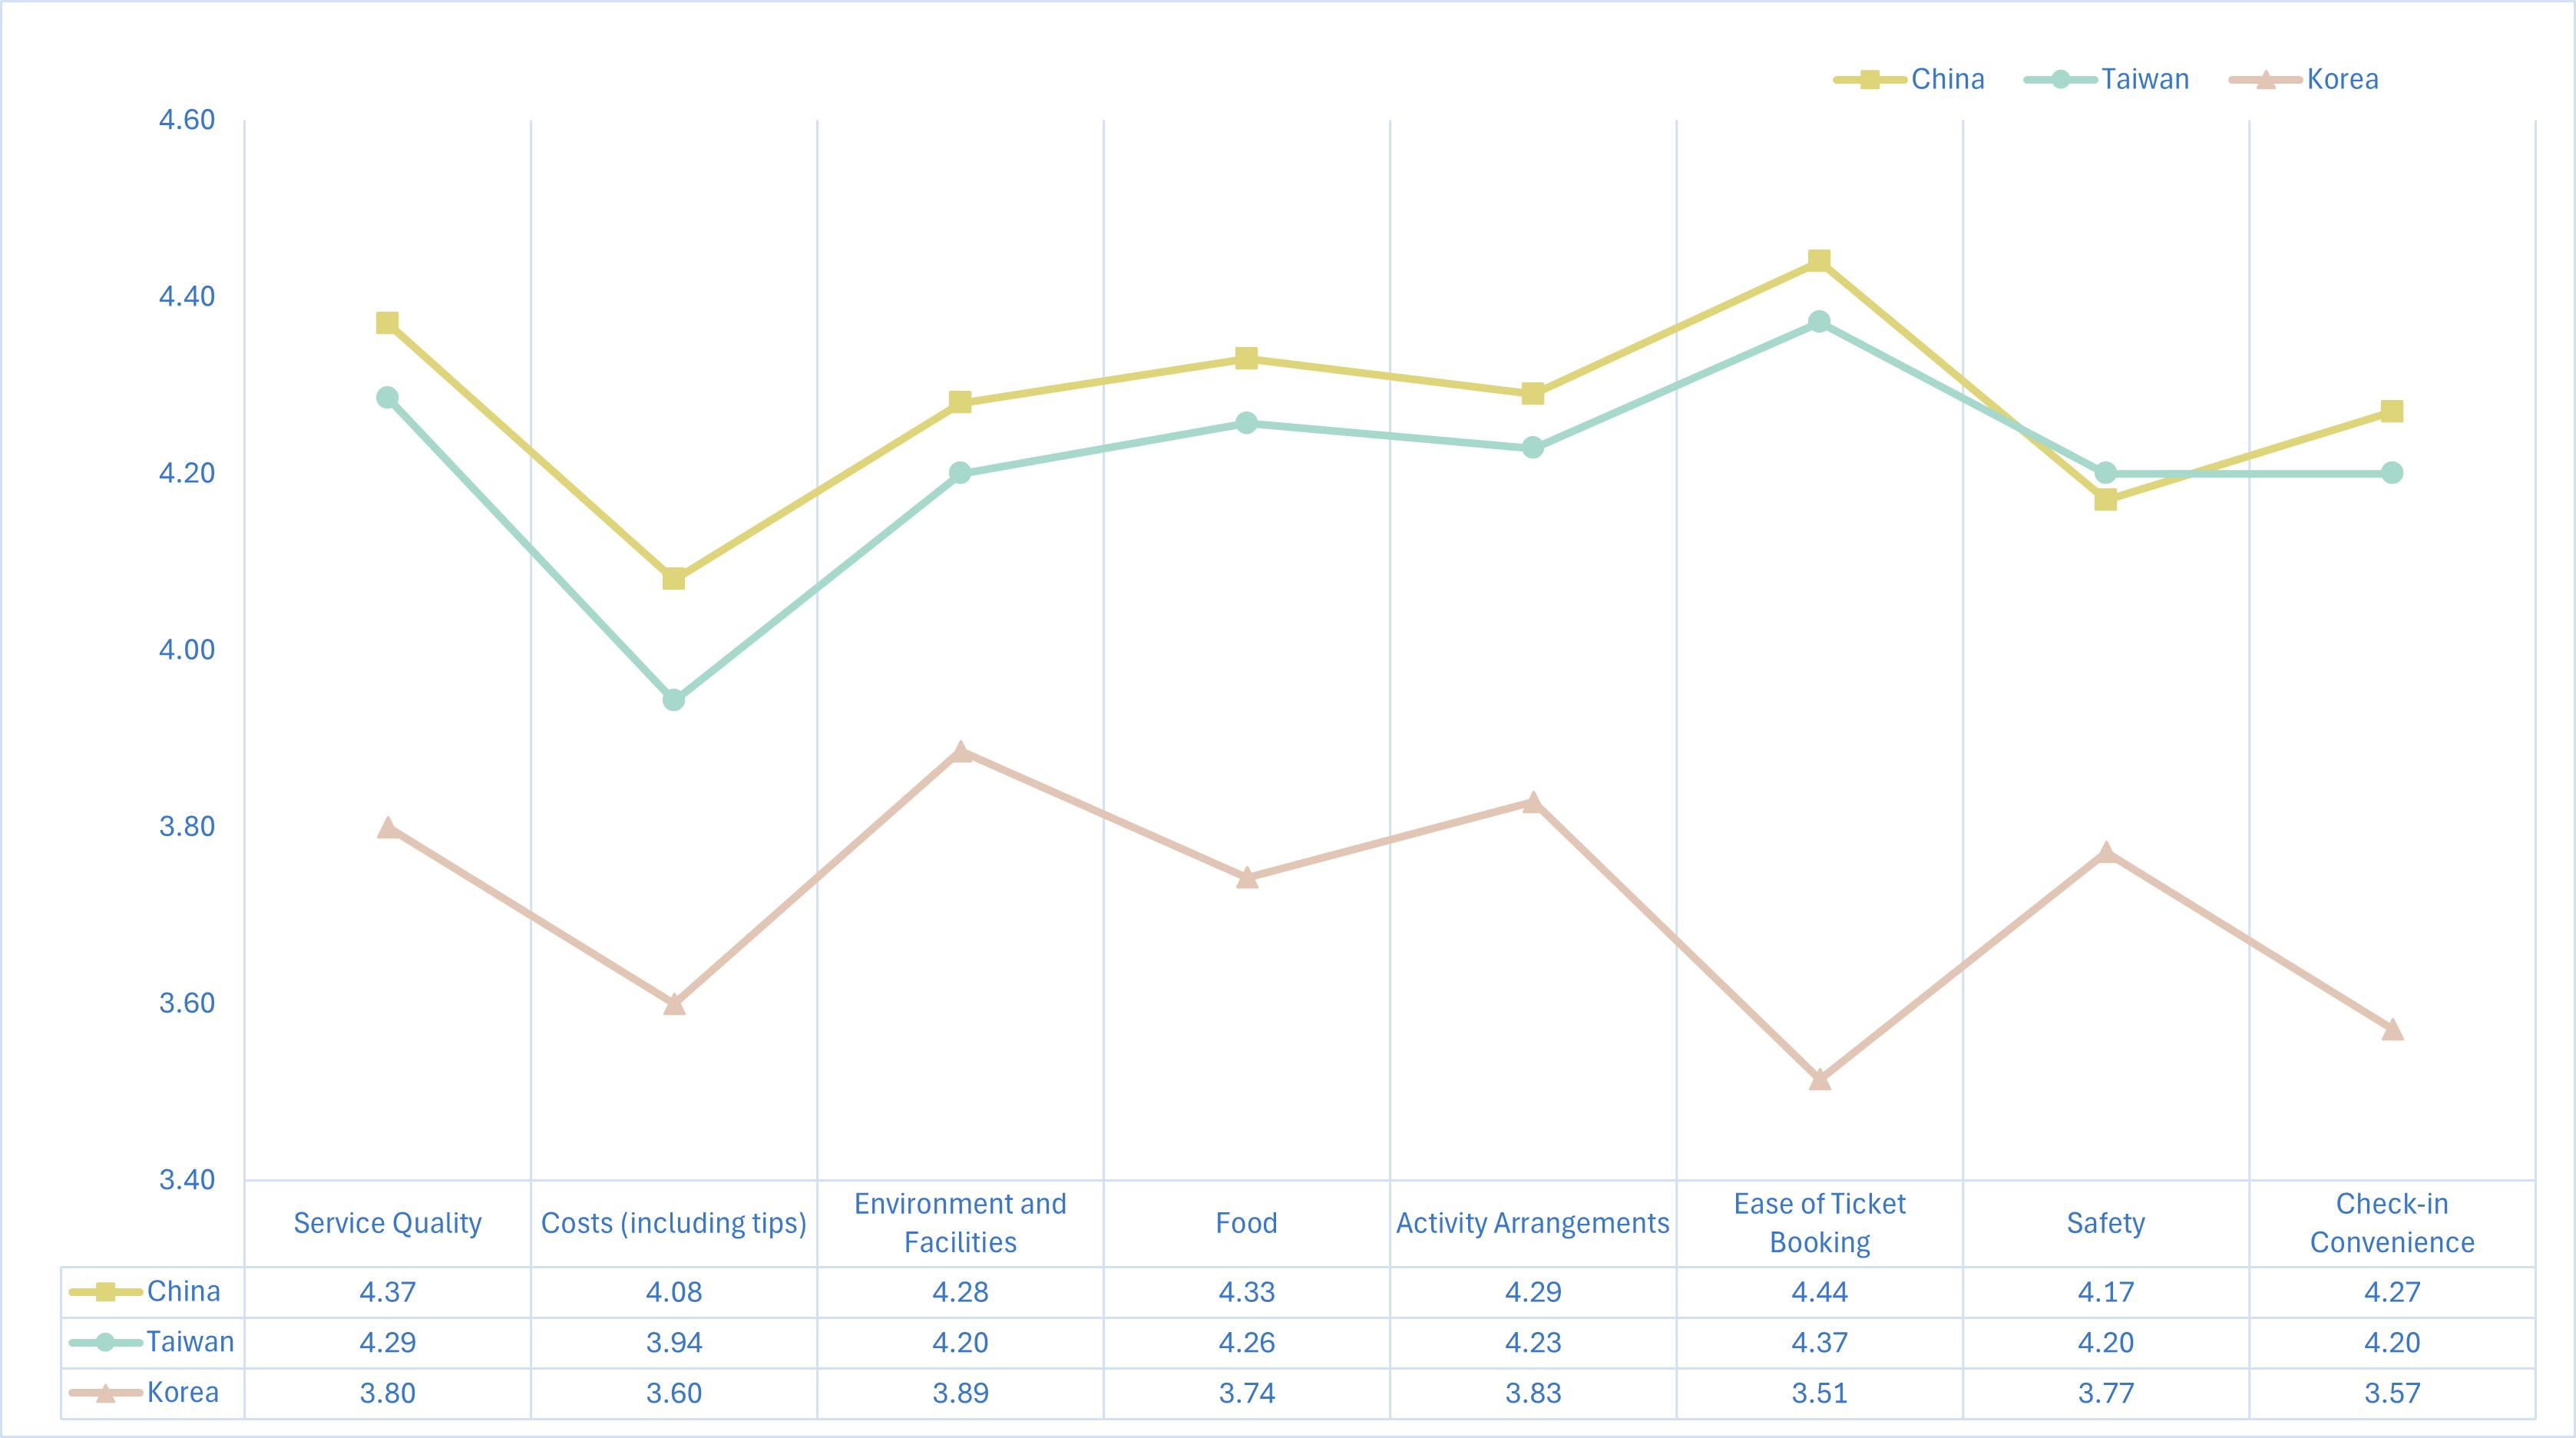
Overall, the satisfaction of Korean cruise tourists is lower in many items compared to tourists from China and Taiwan, with significantly lower satisfaction particularly in “ease of ticket booking” and “check-in convenience.” On the other hand, Chinese cruise tourists have higher satisfaction levels in almost all items compared to tourists from other countries. Taiwanese cruise tourists have the highest satisfaction with “safety” among the three countries, but their satisfaction levels in other items are almost the same as those of Chinese tourists.
Satisfaction of Cruise Tourists by Gender
To analyze the satisfaction levels of cruise tourists by gender, we have summarized the results as shown in Figure 2.

The results show that male satisfaction levels are higher than females for most items. In particular, satisfaction with “environment and facilities” and “activity arrangements” stands out among men.
On the other hand, female cruise tourists slightly surpass male cruise tourists in satisfaction with “check-in convenience.”
Satisfaction of Cruise Tourists by Age Group
Next, we looked into the satisfaction levels of cruise tourists by age group1.
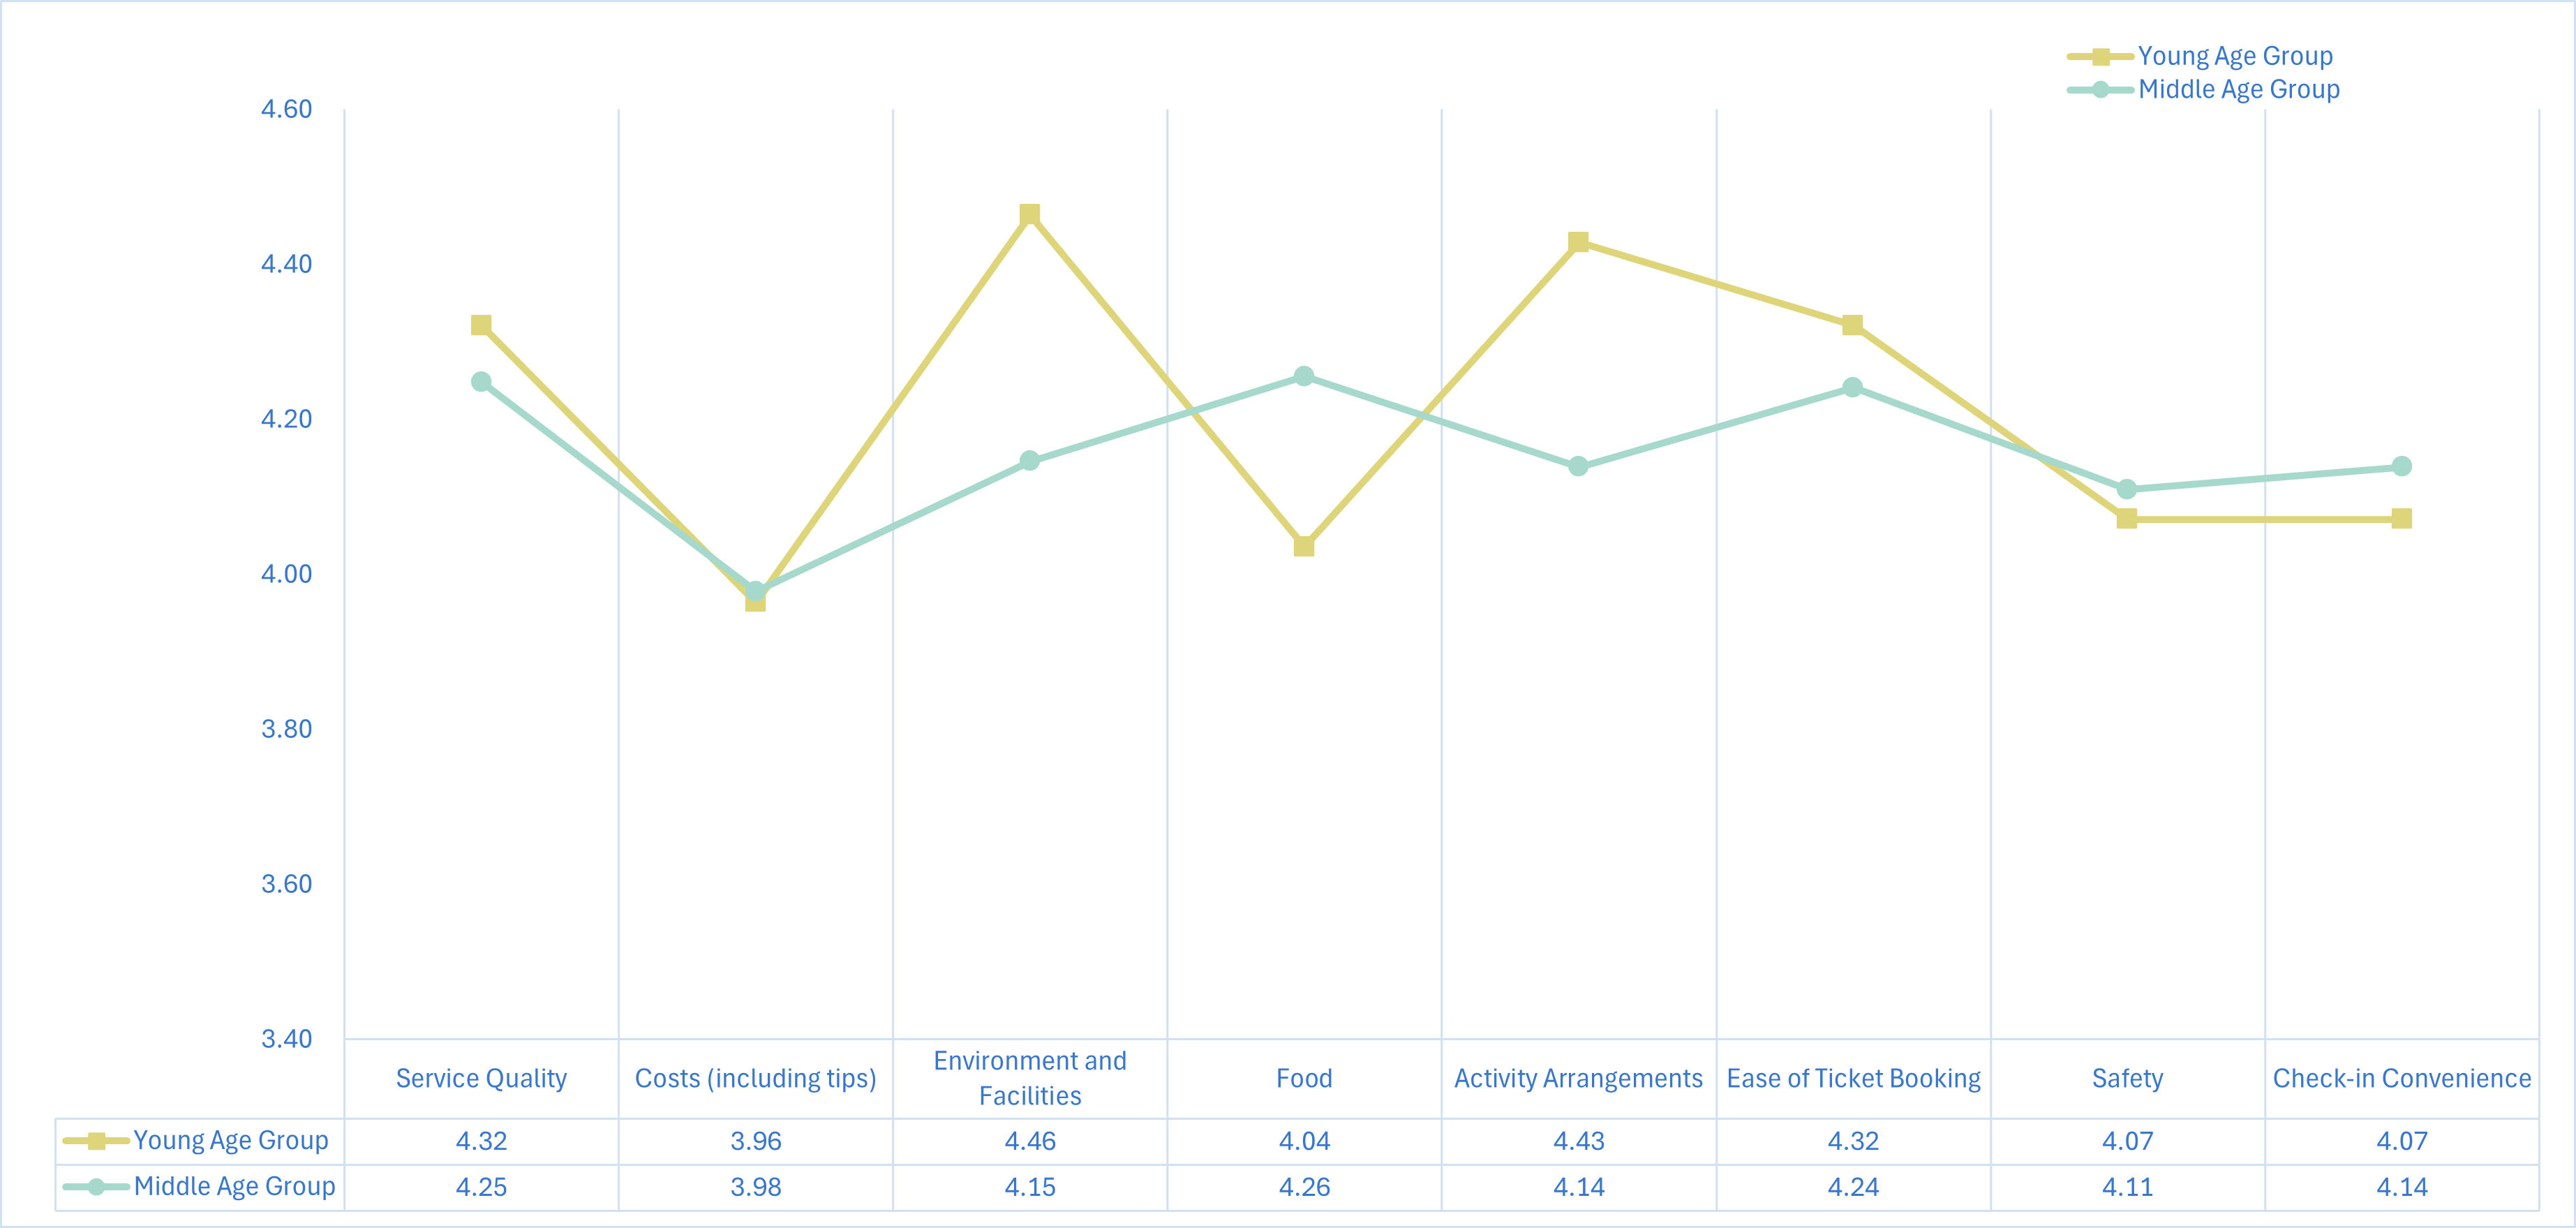
Overall, while the young age group has higher satisfaction in many items compared to the middle age group, there are also items where the middle age group shows higher satisfaction. In particular, satisfaction with “environment and facilities” and “activity arrangements” is significantly higher at the young age group. Conversely, satisfaction with “food,” “safety,” and “check-in convenience” is higher among the middle age group.
Satisfaction Analysis of Cruise Tourists by Income Level
Finally, let’s see how satisfied cruise tourists are based on their income level2 , categorized into lower-middle, middle-upper, and high income groups (Figure 4).
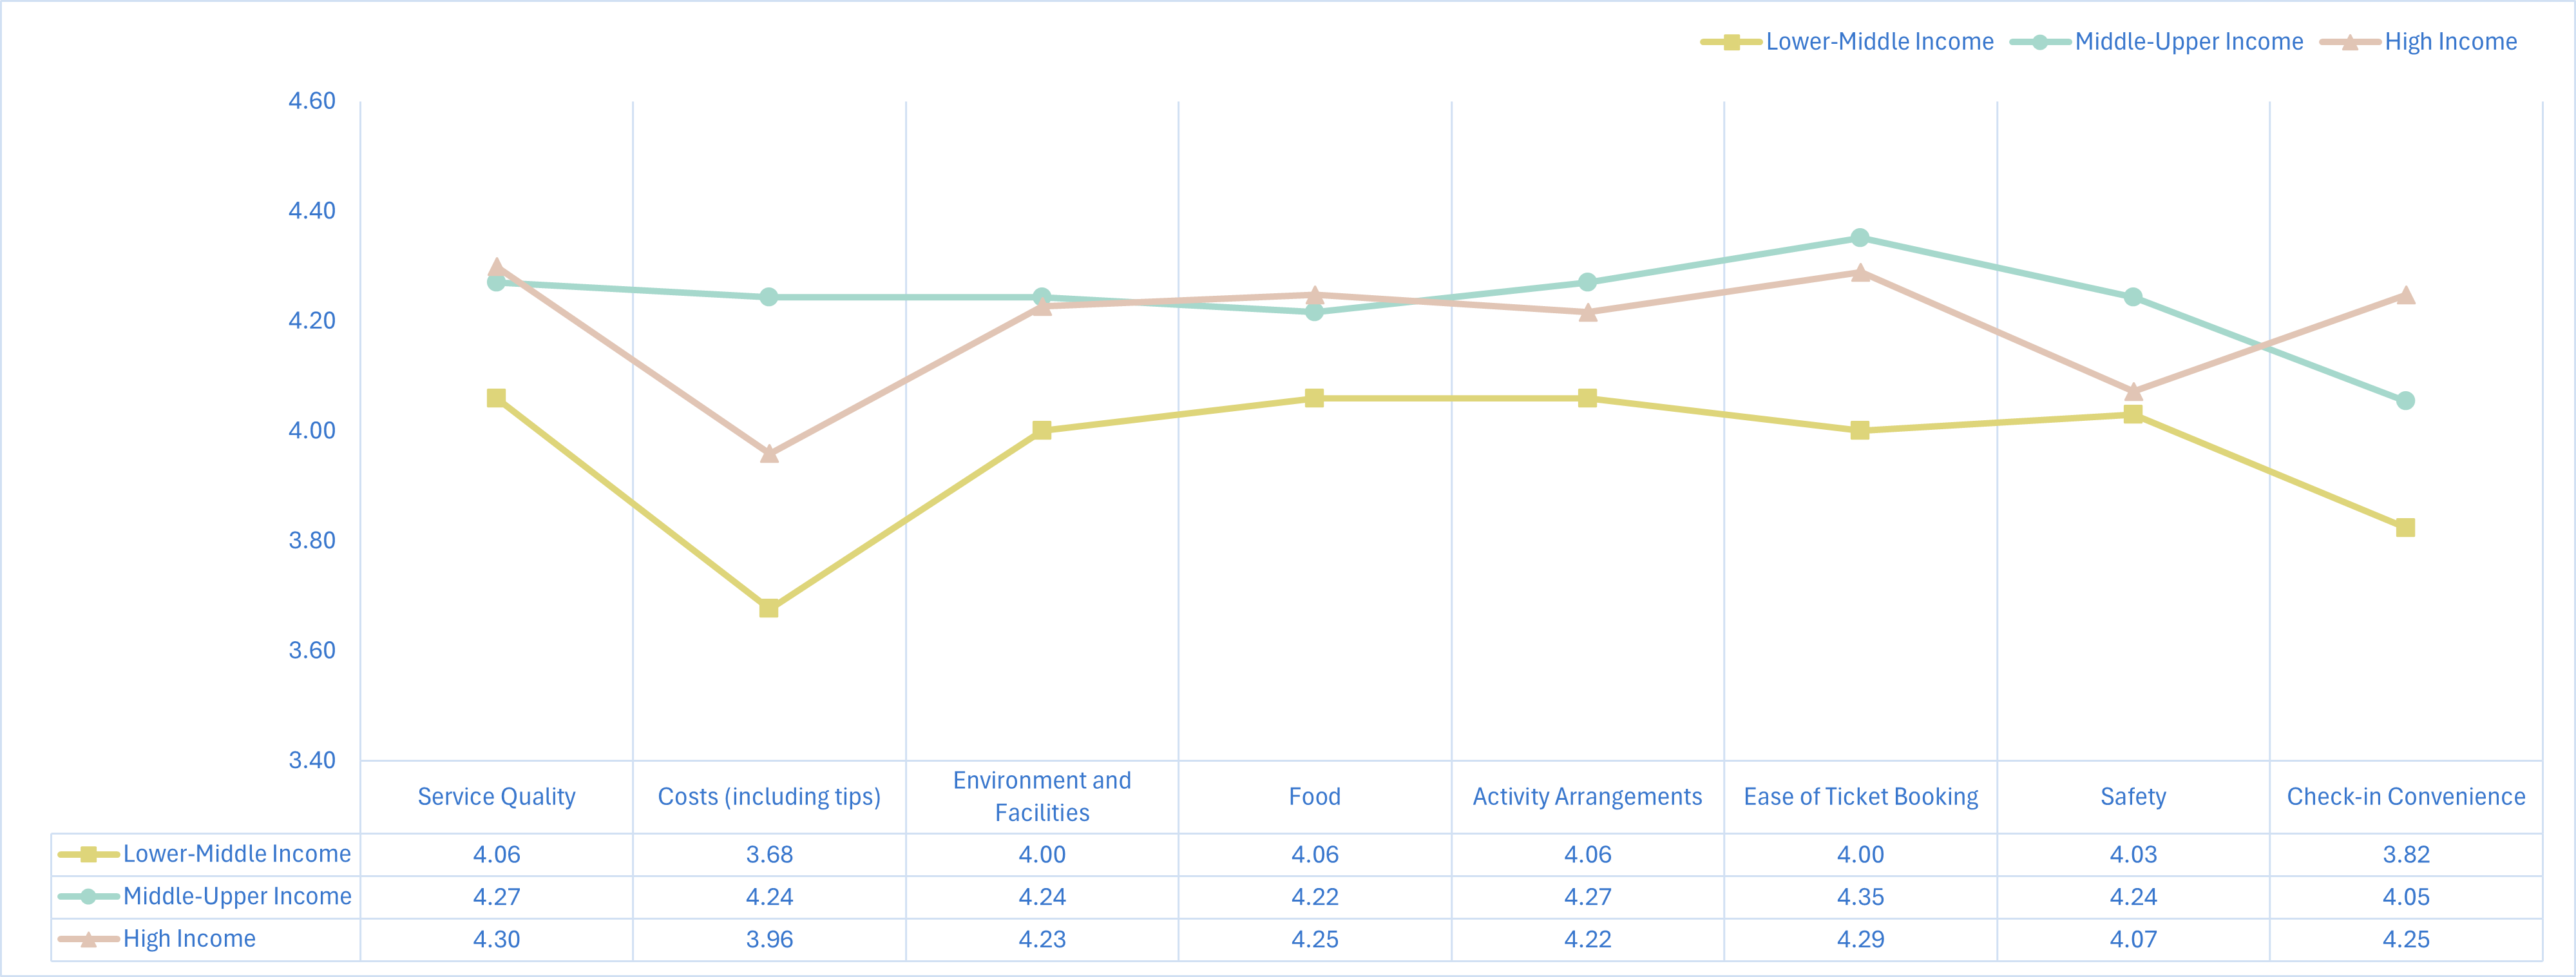
It is clear that the lower-middle group’s satisfaction is the lowest across all items. Their satisfaction with “costs” is significantly low. On the other hand, the middle-upper group’s satisfaction is high in many items, and they show higher satisfaction with “costs” compared to the high income group. Additionally, the high income group surpasses other income levels in satisfaction with “check-in convenience.”
Summary
Based on the results of this survey, the satisfaction of cruise tourists can be summarized as follows:
Satisfaction by Country:
- China: Overall, the highest satisfaction. Especially high ratings in “service quality,” “food,” and “activity arrangements.”
- Korea: Generally lower satisfaction, with significant differences in “ease of ticket booking” and “check-in convenience.”
Satisfaction by Gender:
- Male Cruise Tourists: Higher satisfaction than female cruise tourists in most items, especially in “environment and facilities” and “activity arrangements.”
Satisfaction by Age Group:
- Young Age Group: Higher satisfaction in many items compared to the middle age group, particularly in “environment and facilities” and “activity arrangements.”
- Middle Age Group: Higher satisfaction than the young age group in “food,” “safety,” and “check-in convenience.”
Satisfaction by Income Level:
- Lower-Middle Income Group: The lowest satisfaction across all items, especially low in “costs.”
- Middle-Upper Income Group: High satisfaction in many items, and higher satisfaction in “costs” compared to the wealthy group.
- High Income Group: The highest satisfaction in “check-in convenience.”
From these survey results, service improvements tailored to the specific characteristics and needs of each country and group are necessary. Koeeru will continue to introduce various data in the future.
Survey Overview
- Target Countries: China, Taiwan, Korea
- Sample Size3:
- China: 658 participants (100)
- Taiwan: 506 participants (35)
- South Korea: 501 participants (35)
- Respondents: General consumers
- Survey Period: June 2024
- Method: Online survey (Market Research survey by Koeeru)
Through Koeeru’s global market research, we have gained valuable insights into the behavior patterns and satisfaction of cruise passengers from various perspectives. Koeeru’s team of global research experts and native staff from the target countries are here to provide comprehensive support. For companies and consulting firms interested in utilizing data-driven approaches for marketing research, please feel free to reach out to us.
If you have any questions about the data or are interested in conducting your own research, please don’t hesitate to contact us.
- We have divided respondents into three age groups (young, middle-aged, and senior). However, since there were only five respondents in the senior group, we focused on comparing the young and middle-aged groups for this analysis (young: 30 years and below, middle-aged: 31 to 60 years). ↩︎
- Lower-Middle Group (annual income below ¥5 million, $31,500), Middle-Upper Group (annual income ¥5.01 million to ¥10 million, $31,560 to $63,000), High Income Group (annual income above ¥10 million, $63,000) ↩︎
- The numbers in parentheses indicate the number of cruise tourists visiting Japan from each country. ↩︎
- Tag Cloud
- Survey PanelTourism DXEmployee InterviewOpen InnovationKoeeru GlobalInbound TourismMarket ResearchGlobal Research Case StudyGlobal Research顧客満足度調査Data PlatformAgricultural DXe-CommerceBoliviaZero Party DataAfrica AgriTechInterviewStartup InnovationJICAJ PartnersTanzaniaKoeeru TrendVietnamSmart CityCEO BlogGlobal expansionTop NewsSocial EnterpriseCustomer ExperienceTop Case StudiesArticleCareersTop ArticleNewsJETROTourismHotel Marketing
Related Articles
-

Articles
[CEO Blog] When the Voices of the Customer (VOC) Don’t Show Up… The Pains and Joys of VOC-Driven Management
-

Articles
Unlocking Customer Data – Challenges of CDP Adoption in Vietnam & SEA
-

Articles
📣 VOC Is Essential, But Not Easy — How Koeeru Solves 3 Major VOC Challenges
-

Articles
Food Buying Habits in the U.S., Japan, and China | Part 4
Receive Updates to your Inbox!
Sign up for our newletter to receive timely updates, how-to tips, and invitations to webinars and events.